

Background
I recently have had many chances to ask many different people out of my company and its contractors, whether they heard something about the conjoint analysis. By now, each time the answer was exact or similar to “Not, at all”. Moreover, none of the recipients intended to even ask what is it about. Seeing that I started to feel very strange, since everyday in my job the conjoint is the most basic and important topic. The problem is how to explain, what it is, briefly and simultaneously accurately. Einstein might have (it is uncertain see this page) said “if you can’t explain it simply you don’t understand it well enough”, so let me try to do it.
Introduction
Conjoint analysis is a market research technique and nothing more.
No matter which approach is utilized, a typical market research process is consisted of the following steps. Firstly, having request from entity X, marketers define a problem to solve, then basing on that they collect data by involving selected group of respondents in filling specially designed surveys. After survey set is over, marketers analyse outcome using relevant statistical models. Then, actually the most important part, they need to interpret analysed data correctly in order to finally present to the entity X a solution of the defined problem.
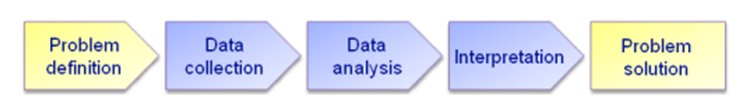
A typical market research process (http://ams-centre.com/)
Marketers utilize a conjoint technique to determine what attributes/features a new product/service/sth called concept should have and, mostly in business cases, how it should be priced. They do it by showing to respondents prepared set of tasks (design). There is always a one answer per task. Each task is consisted of one or more concepts composed of multiple attributes (2 or more). Options which can be displayed for an attribute are called levels. Respondents evaluate concepts by rating or making choices among them. Those evaluations are collected by a researcher.
One may find that the origin of the adjective conjoint is that in study features/attributes of a concept are CONsidered JOINTly. According to Sawtooth Software, though, the word “conjoint” derives from the verb “to conjoin,” meaning “joined together.” (see history)
Idea
The idea behind conjoint analysis is, using attributes joined together we are much closer to real life choices/situation than by surveying with attributes considered separately. For instance
- Car attribute “driver extra side airbag” considered separately:
The car I would like to buy should have driver extra side airbag:
- I agree
- I don not agree
Then most of the respondents mark 1)
However..
- Car attribute “driver extra side airbag” with two possible levels (driver extra side airbag /no driver extra side airbag ) considered jointly:
You are young single, your salary is below 1000 Eur per month, the car I would like to buy is:
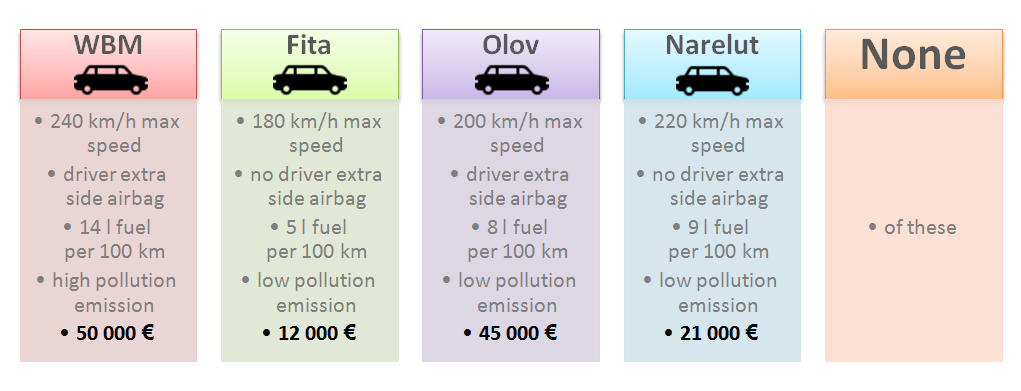
Example survey question with attributes considered jointly
Then the answer is not so obvious, one is forced to make difficult tradeoffs and it is much more real life situation, especially when it comes to buying products. In fact, there is not silver bullet car or any other product/service etc.
Origin
In 1964 mathematical psychologists and statisticians Luce and Tukey released a research paper on Conjoint Measurment. I am not able judge that it was the first and only article on conjoint but experts from Sawtooth mention it as a significant one (again history). After several years marketing researchers borrowed that theory and henceforth the conjoint analysis started to evolve. In 1974 McFadden released a paper on econometrics related to choice behaviour. Upon this work, a new important type of conjoint analysis i.e. discrete choices was then built (again, according to Sawtooth Software) .
Thus, we can say shortly that the conjoint analysis has been in the market research world since early 70’s of 20th century.
Techniques
As you probably noticed it seeing Origin section, the conjoint analysis has been evolving for years and actually it does not denote only one technique for surveying. To be exact, we can divide types in many different ways. The following classification bases on the presentation (unfortunatley not present online) of experienced conjoint researcher – Peter Kurz. In fact, It is not the same as in the mentioned slide show, however having much in common I am sure it is well founded.
- First type is a Traditional Conjoint or Card-Sort method. Using it one concept per task is shown to a respondent. An each product/ service is consisted of all attributes that exist in study – such case is called Full profile A respondent is asked to rate a concept for instance in 0-100 scale. Example Card-Sort task:
Using a 100-pt scale where 0 means definitely would NOT and 100 means definitely WOULD…
How likely are you to purchase

Traditional conjoint question example
- 2nd example within the Idea section above is a simple example of Choice Based Conjoint (CBC) or called interchangeably Discrete Choice Model (DCM), a type developed later than traditional one. Although CBC seems to be the most popular type in practice (based on my experience) it is important to notice we have scientists, involved in the topic, who have claimed that discrete choice experiments are not conjoint analysis at all (see Louviere Flynn Carson article from 2010). Judging it is surely far beyond the scope of this article and actually it would have required deeper analysis. Let us assume that DCM is a reliable and valuable conjoint technique.
- Apart from that we have Adaptive Conjoint Analysis (ACA, ACBC, etc.) which idea behind is to adjust (during a survey) next tasks upon respondent previous answers in order to get more valuable output from individual or group of people.
- There are also Hybrid conjoint methods combing described above, as well as, other market research techniques with the conjoint.
Choice based conjoint
Intuitively, discrete choice model seems to be best options in many real life cases, especially business ones like new product development. In DCM we have a target concept and competitors within a question. In many cases the None option, allowing respondent to quit, is also present. An each concept has attributes that describe it, in particular, a price and a brand. Hence, it is the same situation like standing behind the market shelf and trying to choose one of the products.
When we have many attributes in study then naturally not all attributes are displayed within a concept. Such design is called partial profile model. DCM allows marketer to conduct surveys in that way.
Also having many attributes and concepts per task one can use fractional factorial design – not all possible combinations of attributes within a concept are displayed during a study. Such approach is well documented.
Moreover, also number of attributes could vary among concepts since products or services, despite similarity, could have different features. Such designs are called Alternative Specific Designs (ASD).
Design could be static, in other words created manually or semi-manually by researcher, but also random – tasks are generated automatically by dedicated tool. Stochastic approach is particularly useful when we have a fractional factorial survey. Additionally CBC can be done adaptively, what makes it even better considering collecting relevant output. Important work on that was presented in 2003 by Toubia, Hauser and Simester. Actually, there have been many followers on this article like Saure, Vielma in 2016 (refer to the one ), also popularity of artificial intelligence, machine learning or genetic algorithms might lead to obtaining of more properly adapted surveying in practice.
Sounds it is a perfect model for collecting the data. The question is why conjoint is not a standard and why it is not always utilized in market research … Well
Conjoint is not trivial
The conjoint analysis is an analysis and it is a market research process. As mentioned in Introduction such one is composed of stages. At each stage marketer has to make proper decisions and conduct a particular research according to relevant theories and former practice of conjoints. If you think the analysis is just an analysis, there is no question of an analysis. Actually the conjoint research is not trivial. What you have seen above is more like bird eye view of the analysis. By now they have been nothing on data analysis and Interpretation stages and a very little about technical aspects of data collection.
Problem definition and data collection
There are rules for defining attributes and their levels, as well as, number of them per concept. Then a marketer have to determine a number of tasks in study, a method of data collection and analysis. First of all, attributes have to be independent, an each level within is assumed to be mutually exclusive of the others i.e. respondent can choose only one level at the same time. Levels need to have unambiguous and concrete meaning for instance $2900 instead of very expensive. The usual number of levels per attribute is 3-5, but when it comes to a price or a brand attribute we could have much more… Again, describing all the rules and cases is far beyond the scope of this into article. Important is to see that a lot of topic have to be taken into consideration.
Decisions on a design affect a whole process, obviously. A marketer aims to get valuable data without confusing any respondent. Thus, one have to avoid presenting swarm of tasks or concepts or attributes per concept. On the other hand a researcher cannot end up with not sufficient output when number of tasks, attributes etc. is too small.
A data collection could be conducted by any technique, hence PAPI (Paper and Pencil Personal Interview) survey is possible, however using assistance of computer (CA), thus web surveys and interviewing personally or in closed groups sometimes via phone, seem to be the most appropriate options.
Below example CAWI (Computer assistance web interview) CBC task when a web browser is used to display questions, Each time only one task is displayed on a computer/tablet/phone screen, one choice feasible only:
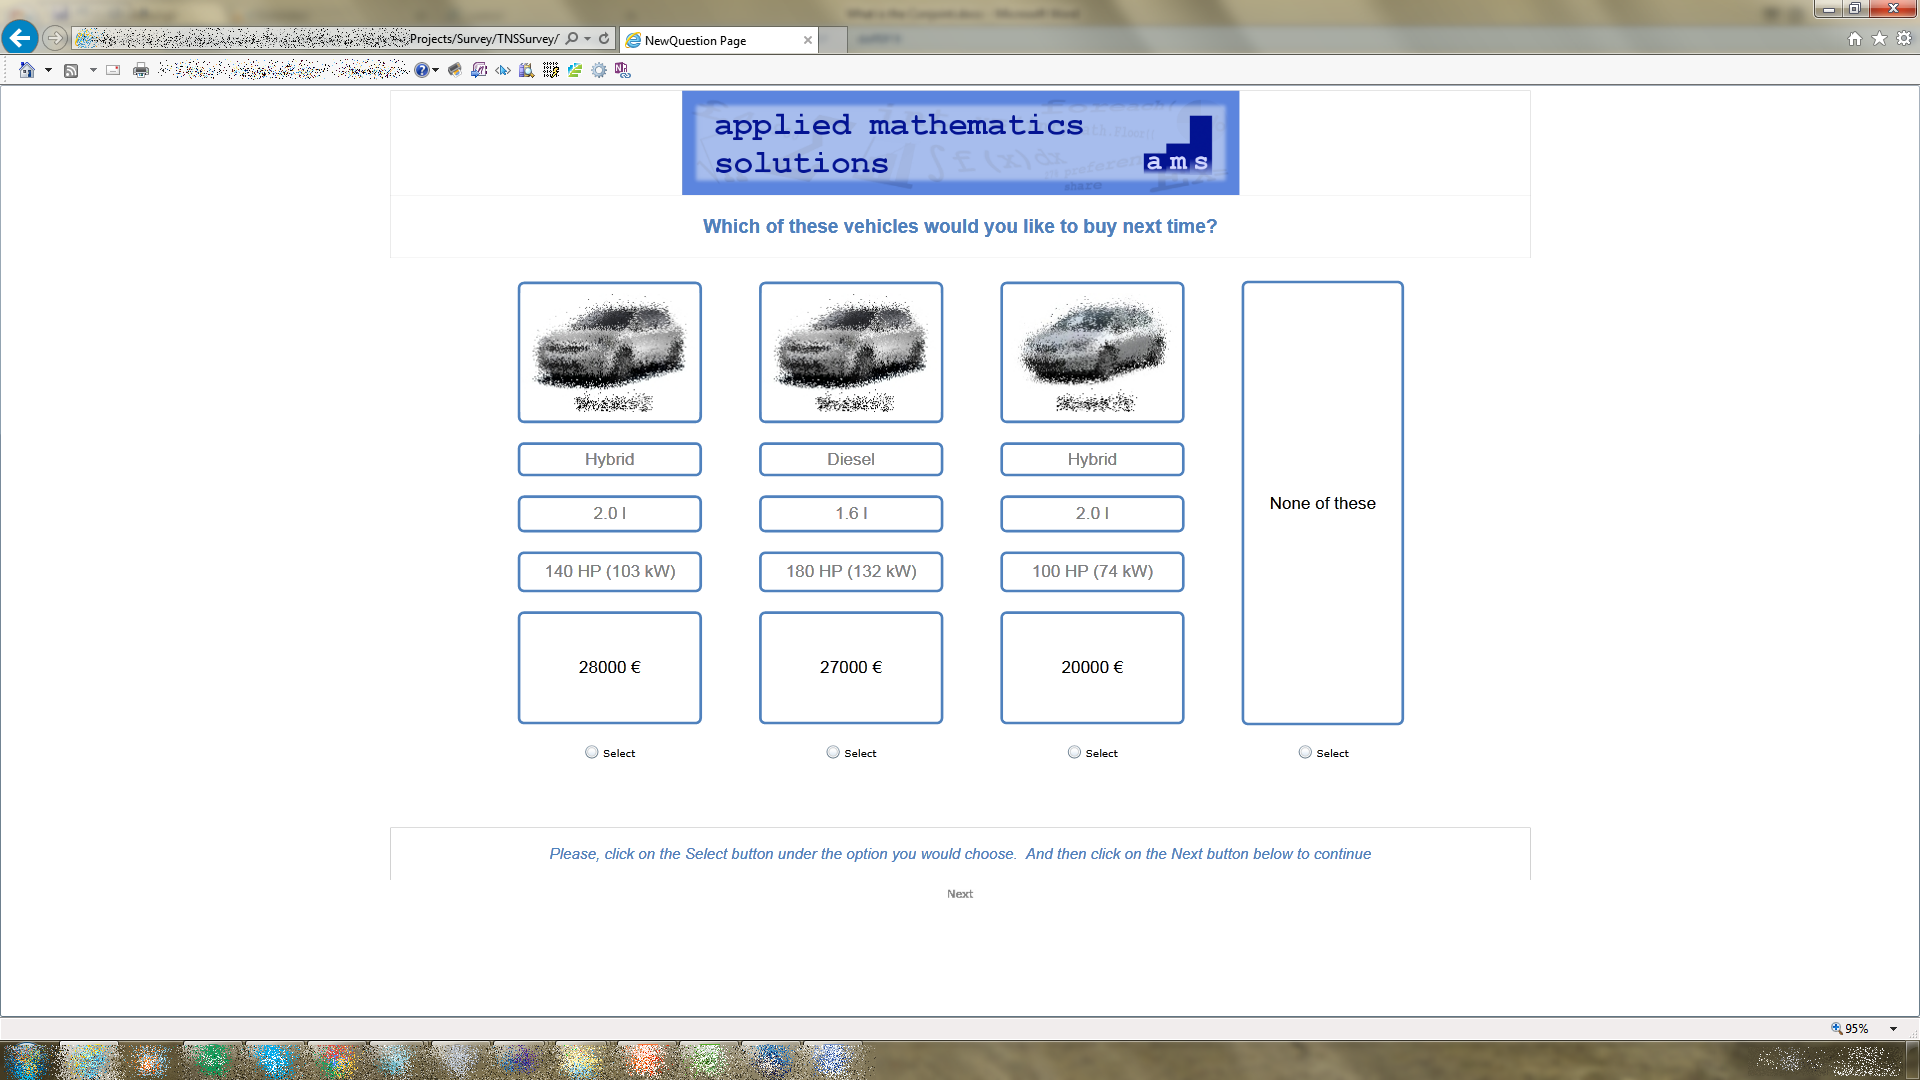
Example CBC CAWI task displayed in a web browser
Having data stored in hard disks of a computer it can be analysed then with help of dedicated statistics and market simulation software tools. Important decision here is to determine how many respondents need to take part in a survey in order to have sufficient data at output.
Although CA surveys seem to be the most convenient option, there are also problems. One can have broken connections, incorrect layout displays, or respondents who quits survey before it ends and therefore incomplete output and what is worse angry participants.
Data analysis and interpretation
After data is collected marketer chooses a statistical model in order to, first and foremost, know how valuable are attributes and their levels. Measures called utilities or part-worths or part-worth utilities tell about that. Depending on the project type and basing on a researcher experience and knowledge one can use one of many models. The Counts seems to be easiest and the most intuitive one, when proportions of wins for each level are calculated, based on how many times a concept including that level is chosen, divided by the number of times a concept including that level appeared in the task. When a researcher has a CBC study, then more complex, thus sophisticated, models like Latent Classes when segmentation is important, or popular Hierarchical Bayes (HB) estimation that operates on each individual data, but also Logit and others, can be utilized.
After that, using utilities a researcher can do further analysis, where simulators are helpful to get useful interpretation factors for instance preference shares, price sensitivity etc..
Again, many decisions have to be made by a researcher and deep statistical insight is required or at least very good command on estimation and simulation tools. Not only results but also designs, formerly displayed within a data collection stage, have to be analysed. For the example having similar concepts in a study, one should keep in mind the so called Red-Bus/Blue-Bus problem because otherwise, by choosing improper estimation model, they can improperly either decrease or increase an utility of a particular level. You can read more about it on the Internet for instance here
To summary it, yes it does. The conjoint is not trivial, since many mistakes can be made until a marketer finds a solution for a defined problem. Even the best market research tools do not do the whole job without researchers or perhaps in future complex intelligent machines.
Problem solution
Having respondent answers, utilities, and outcome from simulations marketer can present a suggested meaningful solution to a client. Then one can say that a conjoint is over.
Human factor
Last but not least, a human factor. Real respondents are not machines they are humans (at least assumed for today) and thus not only raw data is important also psychological aspects matter. Basic question is whether selecting a concept is truly the same situation as choosing from supermarket shelf, because actually one do not spend real money during a survey… Another thing is that depending on current own mood, a respondent can make different, more spontaneous or on the opposite more conservative decisions etc. than usually. Those aspects are hard to measure correctly even if segmentation, extra questions are applied and correct decisions are made.
Unfortunately, as always, even the greatest conjoint outcome could be manipulated or presented selectively by a client or other third parties to meet their goals.
Summary
The conjoint analysis is a market research technique which is relevant to support making decisions regarding new product/service development. It could be applied in many areas both business or any others successfully. A respondent evaluates concepts consisted of attributes, displayed individually or among others. Although it seems to emulate real consumers decisions perfectly the conjoint is arduous and mistake sensitive process. The conjoint requires researches with great insight into statistics and market research in general, otherwise one can get wrong outcome. Hopefully, the development artificial intelligence and thus adaptive models can make the technique more adequate, reduces human factor troubles and number of failures possible during the process.